Features & Benefits
Regular Data Updates
While school is always on a fall to spring calendar, the sharing of data is not. At K12enroll we upload and post data updates throughout the year to ensure that your district enrollment data is updated and relevant for today’s decision making. We seamlessly do the work behind the scenes to post enrollment, birth, housing, growth, and change rates on a regular basis. It’s very possible that your district's data will change several times throughout a school year. Gone are the days when enrollment projections are thought of as a once a year activity. You have important decisions to make based on your enrollment projections and we are your resource for always doing so with the most current information.
Reports to Share
Communicating enrollment information is a necessary task, but the audience often changes. From school board members to parent groups, staff to bargaining groups, principals to transportation staff – there are many different interests in enrollment projections. The K12enroll application generates reports that are easily shared, distributed, utilized, and embedded in other presentations. The report is simple enough to attach to an email if that meets your communication needs. Yet it is detailed enough to build into an entire slide deck presentation if that is your need. These reports make you always be in the know and able to present accurate information with just a few clicks.
Multi-Projection Methods
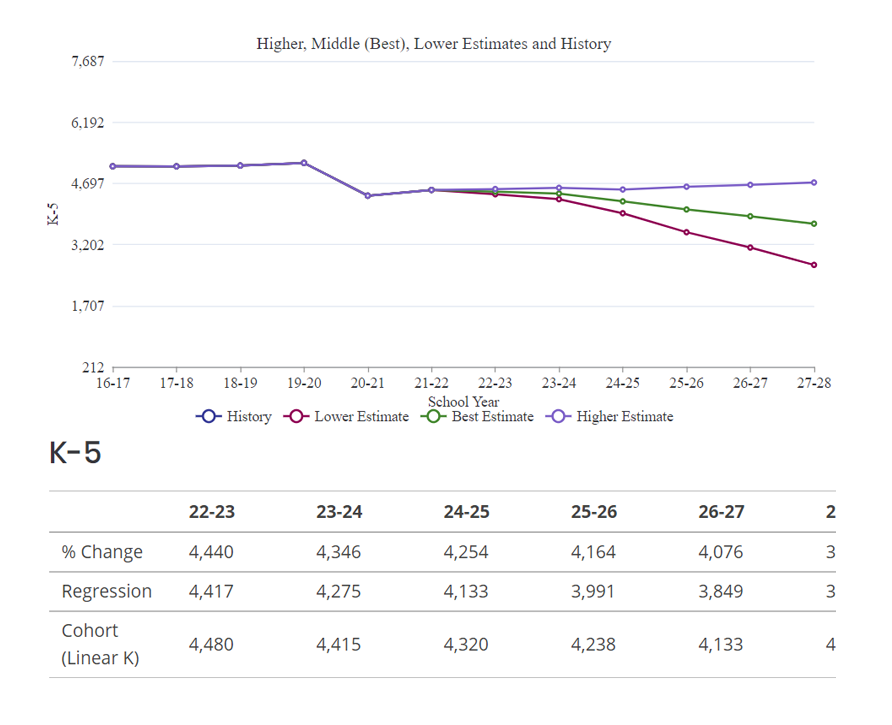
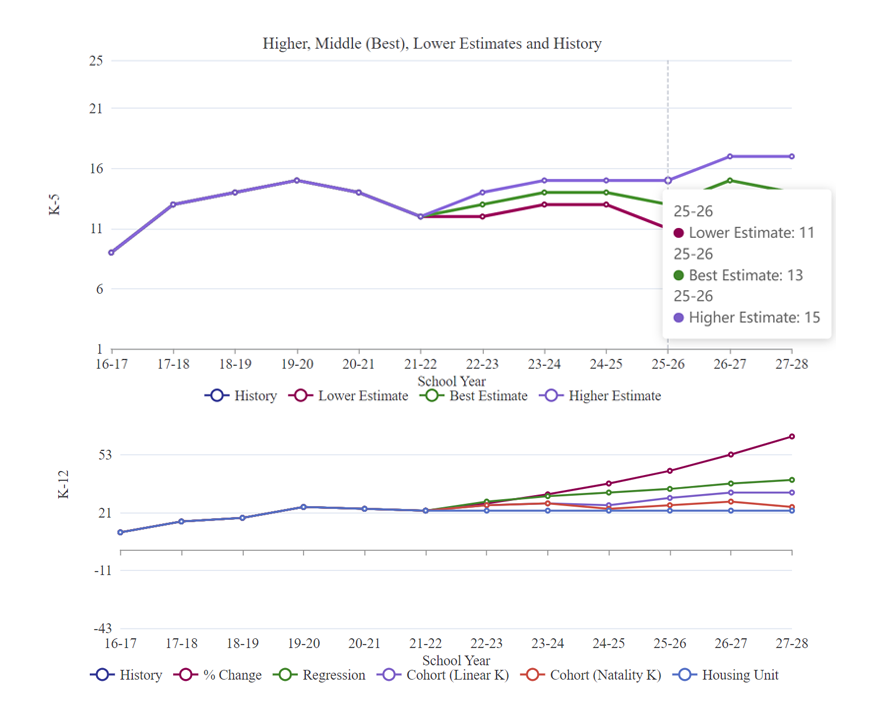
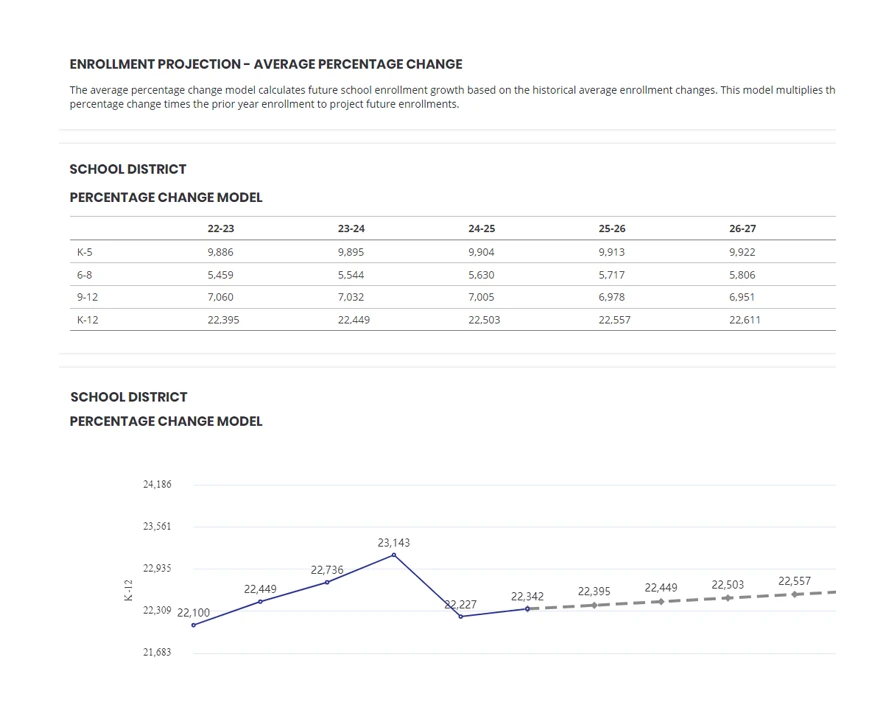
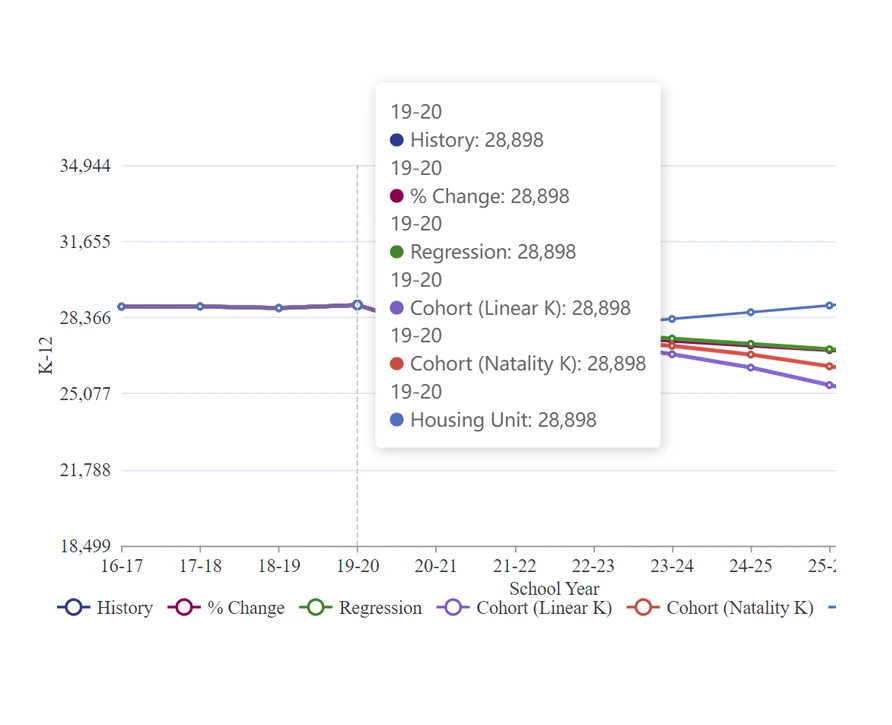
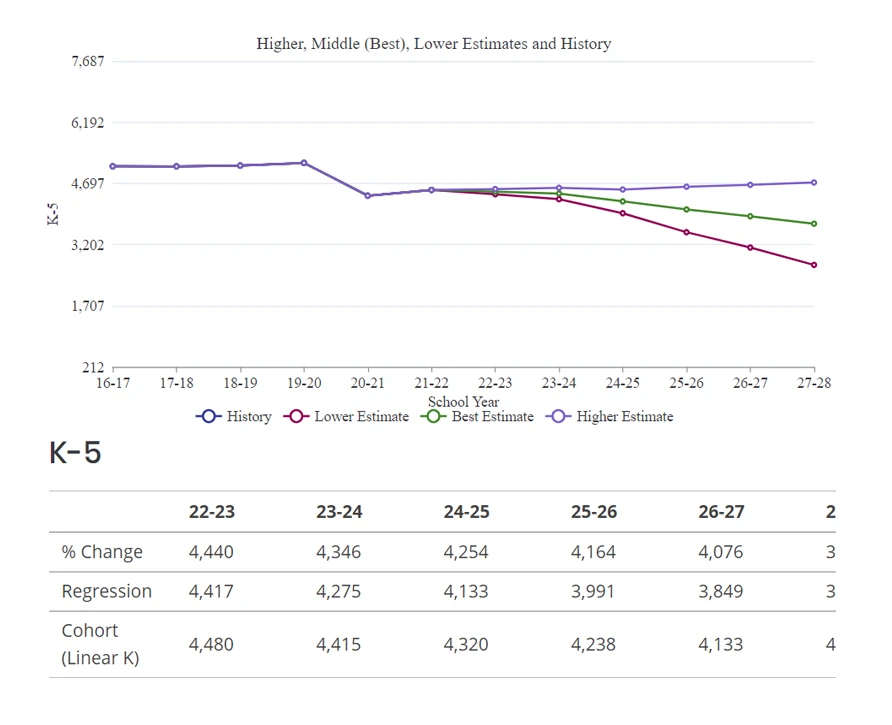
To identify trends and prepare for adequate spaces, materials and supplies, and teaching staff, school leaders use several methods of projecting enrollment. At K12enroll we know that no one model is foolproof, so our team provides school leaders with several models so patterns might be discerned. Many state level reports that are provided to districts are limited to one single projection. This singular approach is basing these important decisions on a single data point. In years like now, with significant change due to COVID, the data is often mis-represented by large changes in enrollment. Our models include average percentage change, linear regression, cohort survival (two sub-models), and student per housing unit models. It is important to note that all enrollment projection models provide only estimates of future populations.
Always Accessible
Because most of these models use historical information as the basis for projections, our K12enroll Team encourages school districts to update their projections multiple times throughout the year. Because our system has regular data updates as new data becomes available, our K12enroll system is always available for you to have the latest information. In many states there is a “window” when new projections are out for the year. However, we all know that snapshot projections are less helpful than having current and updated information. Being a web-based application and accessible in the district you are no longer required to embark on a robust process for projecting – our reliable enrollment projections are always accessible.
Historical Enrollment Data
The single greatest predictor of the future – is the past. At K12enroll we have over 20 years of historical data for your district and use it as the basis and starting point for enrollment projections in the future. While communities change, develop, and grow we also know that many of the trends start several years leading up to change. If you have had a change of district staff, shifting enrollment, change, growth, and unknown trends we are your partner in overcoming those gaps. The best part about it is that you are not required to upload or use your own data, instead we automatically retrieve and load data on your behalf.
Uses Local Housing & Birth Rates
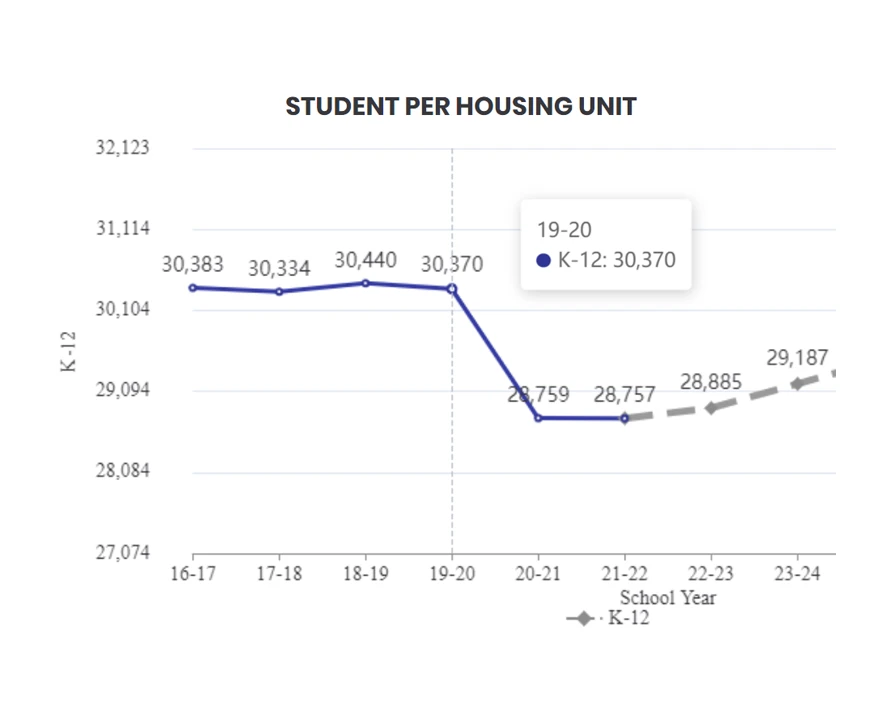
Two local growth factors influence school enrollment more than anything else – housing and birth rates. Our K12enroll team works directly with local authorities, health, and housing agencies to monitor these statistics on a regular basis and use them in our enrollment projections. Those students born this year will become kindergartners five years from now, so we can accurately couple growth and change rates with birth rates to estimate your kindergarten enrollment into the future. We also know that when local housing units are increased, they provide additional housing and student growth occurs. The day to day operational life of a school or district leader does not always afford you the time to monitor these changing trends, let us do that for you.
Regular Data Updates
While school is always on a fall to spring calendar, the sharing of data is not. At K12enroll we upload and post data updates throughout the year to ensure that your district enrollment data is updated and relevant for today’s decision making. We seamlessly do the work behind the scenes to post enrollment, birth, housing, growth, and change rates on a regular basis. It’s very possible that your district's data will change several times throughout a school year. Gone are the days when enrollment projections are thought of as a once a year activity. You have important decisions to make based on your enrollment projections and we are your resource for always doing so with the most current information.

Reports to Share
Communicating enrollment information is a necessary task, but the audience often changes. From school board members to parent groups, staff to bargaining groups, principals to transportation staff – there are many different interests in enrollment projections. The K12enroll application generates reports that are easily shared, distributed, utilized, and embedded in other presentations. The report is simple enough to attach to an email if that meets your communication needs. Yet it is detailed enough to build into an entire slide deck presentation if that is your need. These reports make you always be in the know and able to present accurate information with just a few clicks.

Multi-Projection Methods
To identify trends and prepare for adequate spaces, materials and supplies, and teaching staff, school leaders use several methods of projecting enrollment. At K12enroll we know that no one model is foolproof, so our team provides school leaders with several models so patterns might be discerned. Many state level reports that are provided to districts are limited to one single projection. This singular approach is basing these important decisions on a single data point. In years like now, with significant change due to COVID, the data is often mis-represented by large changes in enrollment. Our models include average percentage change, linear regression, cohort survival (two sub-models), and student per housing unit models. It is important to note that all enrollment projection models provide only estimates of future populations.

Always Accessible
Because most of these models use historical information as the basis for projections, our K12enroll Team encourages school districts to update your projections multiple times throughout the year. Because our system has regular data updates as new data becomes available, our K12Enroll system is always available for you to have the latest information. In many states there is a “window” when new projections are out for the year. However, we all know that snapshot projections are less helpful than having current and updated information. Being a web-based application and accessible in the district you are no longer required to embark on a robust process for projecting – our reliable enrollment projections are always accessible.

Historical Enrollment Data
The single greatest predictor of the future – is the past. At K12enroll we have over 20 years of historical data for your district and use it as the basis and starting point for enrollment projections in the future. While communities change, develop, and grow we also know that many of the trends start several years leading up to change. If you have had a change of district staff, shifting enrollment, change, growth, and unknown trends we are your partner in overcoming those gaps. The best part about it is that you are not required to upload or use your own data, instead we automatically retrieve and load data on your behalf.

Uses Local Housing and Birth Rates
Two local growth factors influence school enrollment more than anything else – housing and birth rates. Our K12enroll team works directly with local authorities, health, and housing agencies to monitor these statistics on a regular basis and use them in our enrollment projections. Those students born this year will become kindergartners five years from now, so we can accurately couple growth and change rates with birth rates to estimate your kindergarten enrollment into the future. We also know that when local housing units are increased, they provide additional housing and student growth occurs. The day to day operational life of a school or district leader does not always afford you the time to monitor these changing trends, let us do that for you.
